
Predicting the volatility of Bitcoin price from buy and sell orders
Bitcoin and cryptocurrency have been hot topics these years due to the rapid growth of the market value. Due to the lack of regulation, the market of cryptocurrency is very volatile and risky for investors. This project aims to construct a systematic way to predict the volatility of the Bitcoin market through the microstructure of the market. The data source is a high-frequency orderbook, which is a snapshot of all the orders listed on the exchange, and they're collected from Tardis, a major cryptocurrency data collector. Various machine learning models and features will be investigated and their performance will be evaluated by different metrics as well.
Team
Xin Ye, Chongdan Pan, Fangzhe Li
Exhibition
@ Umich 2022 School of Information Design Expo
Duration
Nov 2022 - Dec 2020 (2 mo)
Methods
Garch model; Ridge regression; Feature engineering; PCA; XGBoost; LSTM
Bitcoin is a cryptocurrency which notable for being less stable and with stronger volatility.
Objective
This project aims to use the bid price and ask price provided in orderbook, explored new predictors with feature engineering, applied different models to predict the volatility of Bitcoin.
Introduction
Order book
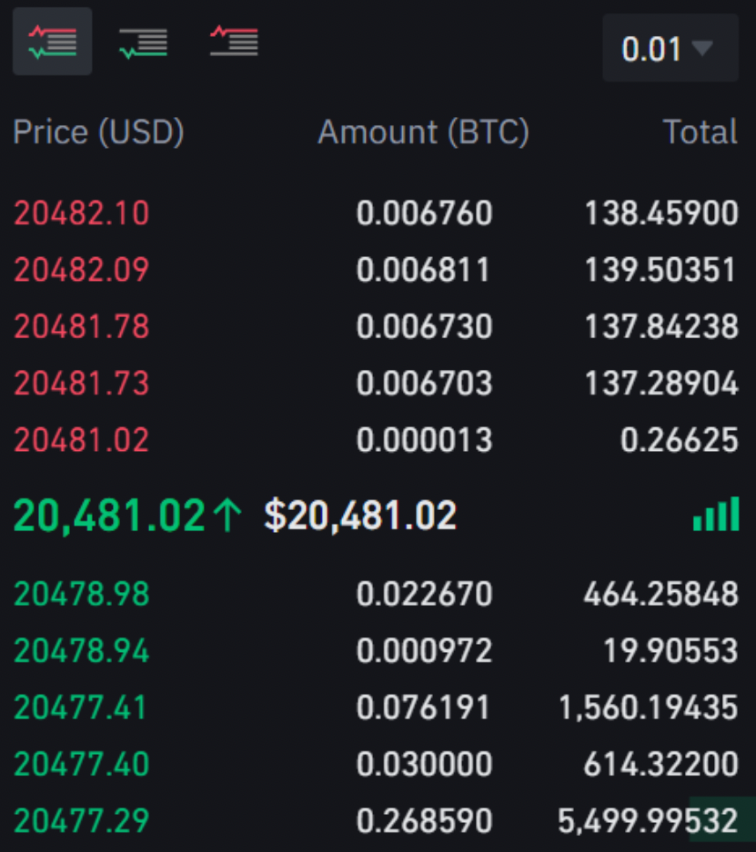
Orderbook
is the main source of the features we used, which is a snapshot of any market that stores all "buy" or "sell" orders information such as price and volume.
Datasets
The orderbook data from Tardis.
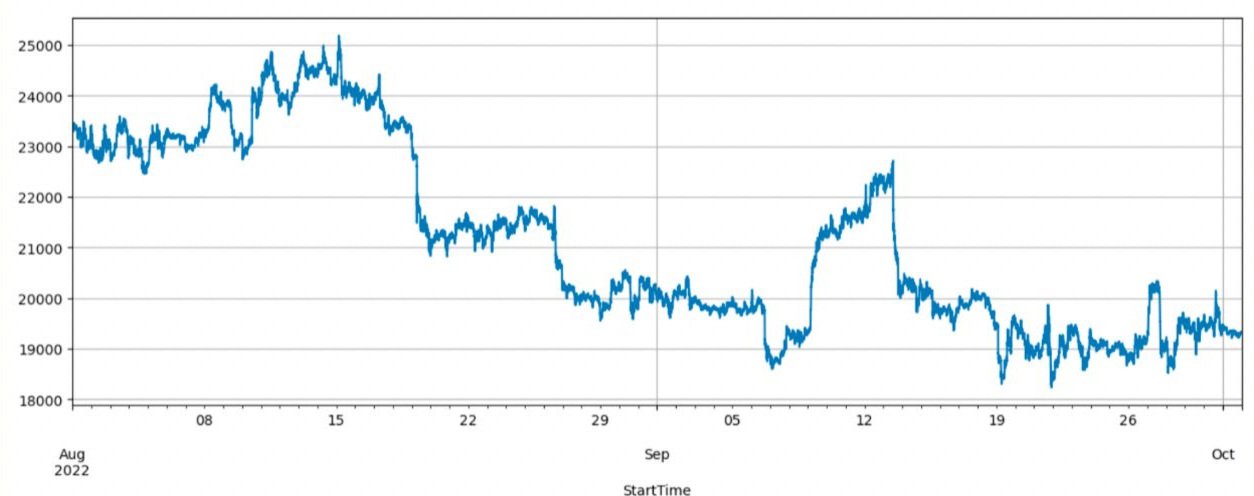
Training set: every 30 seconds from August 1st, 2022 to October 8th, 2022.
Testing set: every 30 seconds from October 9th, 2022 to October 31st, 2022.
our train and test data have gone through different market conditions such as an extremely high peak in volatility.
21 fields as raw features: Timestamp, Ask price, Ask volume, Bid price, Bid volume

Preprocessing
A.Resample the orderbook and chose 30 seconds as length.
Orderbook is not aligned with a specific frequency since people may post trade at any time.
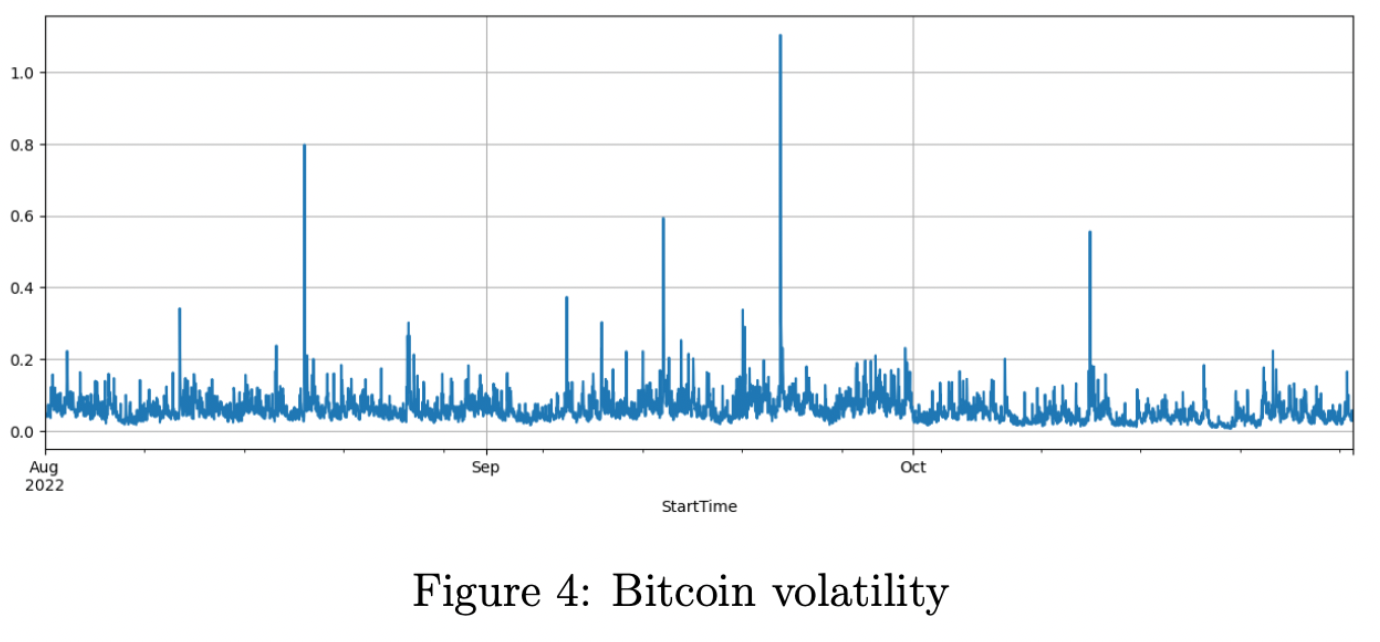
B.Build volatility: the standard deviation of return within a specific time interval.
The volatility is calculated in different time horizons because the return within 30 seconds is too noisy and they usually follow a random walk. We cut the price of Bitcoin by every minute and calculate the return. we scale it by 100 times and group the return by every 30 minutes and calculate the standard deviation as our label.
C.EDA of volatility
Results

Baseline: Garch model
Generalized AutoRegressive Conditional Heteroskedasticity(GARCH) is a statistical model which typically used to predicate the volatility based on the historical return.

Good at predicting the peak of the volatility thanks to its assumption of volatility clustering;Lower bound is too high, leading to a high error.
Ridge with raw order book feature
Achieve a better result than Garch even though it can’t capture the high volatility.
Its supremacy implies that the orderbook’s features contain a lot of information for prediction.
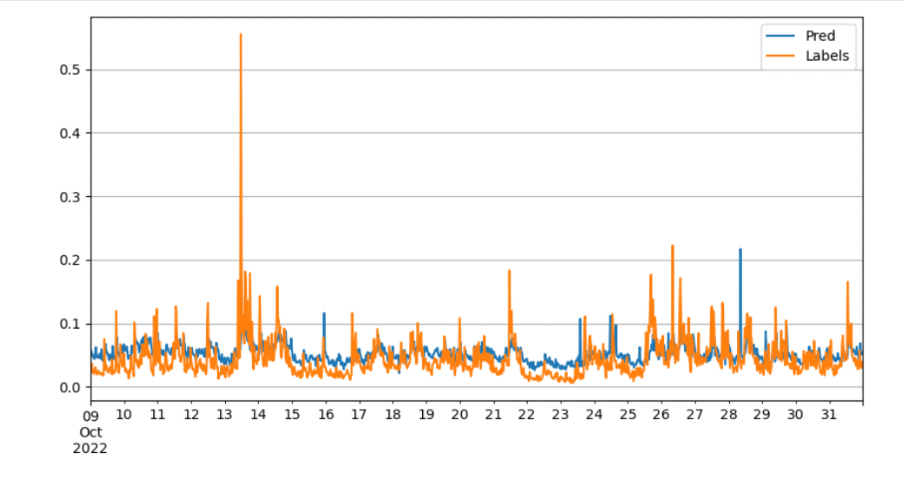
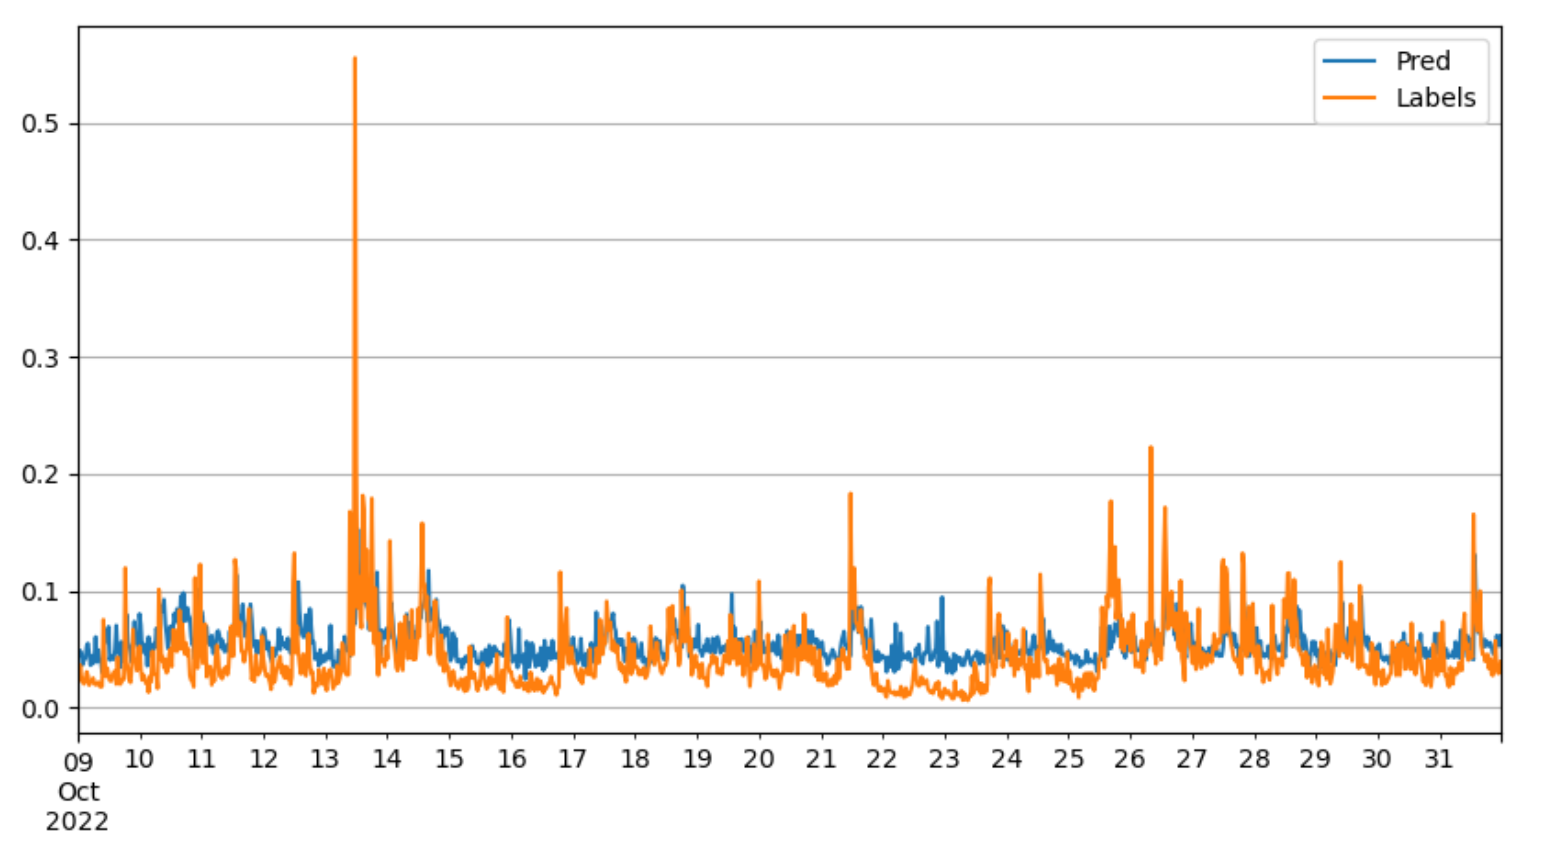
Ridge with PCA and new features
Feature Construction
Mid price: The average between the ask price 1 and bid price 1.
Spread: The difference between the ask price and bid price and normalized by the mid price.
Weighted Spread: Use the volume of each price as the weight to price to get the weighted difference between the ask price and bid price and normalized by the mid price.
Volume Spread: The difference between the ask volume 1 and bid volume 1 and normalized by the sum of ask volume 1 and bid volume 1.
Weighted Mid price: the weighted average ask prices and bid prices.
Also,
Dimension reduction through PCA to prevent overfitting;
Feature Normalization;

Best performance;A less wrong prediction of peak;Normal prediction is closer to the labels.
XGBoost
We’re interested in the XGBoost tree model as well because it can give metrics of feature importance. In addition, it helps us to interpret the data and model better since we’re able to plot the structure of the model.
Surprisingly, XGBoost can’t achieve an ideal performance for prediction even though its ensemble methods are famous for solving underfitting. The worse performance implies that XGBoost is overfitting here, and our best model is actually able to exploit all linear information within the features we have.

LSTM

We also tried LSTM as time-series neuron-network model. LSTM turns out to be as good as our ridge model with PCA. We guess it’s probably because the sequence length is not ideal and the data set is too small to train an LSTM neuron network. We believe if we can handle more data, LSTM should be more robust.
Discussion
Almost all our models can beat the baseline, which shows that with the information included in the orderbook, we can easily beat the prediction of the baseline model only based on return rate information.
Only the Garch model can successfully predict the volatility peak, in the future, we may use the output of the Garch’s prediction as another feature.
Ridge regression model with more features gives the best performance.
Spread and weighted mid price plays a significant role in volatility, implying the liquidity and momentum effect in the microstructure of the market.
References
[1] Guo, T., & Antulov-Fantulin, N. (2018). Predicting short-term Bitcoin price fluctuations from buy and sell orders. arXiv preprint arXiv:1802.04065.
[2] Guo, T., Bifet, A., & Antulov-Fantulin, N. (2018, November). Bitcoin volatility forecasting with a glimpse into buy and sell orders. In 2018 IEEE international conference on data mining (ICDM) (pp. 989-994). IEEE.
[3] Rathan, K., Sai, S. V., & Manikanta, T. S. (2019, April). Crypto-currency price prediction using decision tree and regression techniques. In 2019 3rd International Conference on Trends in Electronics and Informatics (ICOEI) (pp. 190-194). IEEE.
[4] Tsai, Wei-Tek, R. Blower, Y. Zhu and L. Yu, “A system view of financial blockchains,” in 2016 IEEE Symposium on, 2016.
[5] J. Chu, C. Stephen, N. Saralees and O. Joerg, “GARCH Modelling of Cryptocurrencies,” Journal of Risk and Financial Management, vol. 10, no. 4, p. 17, 2017.
[6] Peter R. Hansen and Asger Lunde. 2005. A forecast comparison of volatility models: does anything beat a GARCH(1, 1)? Journal of Applied Econometrics 20, 7 (2005), 873–889